How to Use Thangs Analytics to Grow Your Business
Understanding earnings and analytics on your Thangs dashboard.
Once your profile is set up and your products are live, you might be wondering: what’s next? When you’re building your 3D design business, success shouldn’t be a guessing game, which is why understanding your growth drivers is essential. Thangs provides built-in analytics to help you monitor the performance of your shop and individual models.
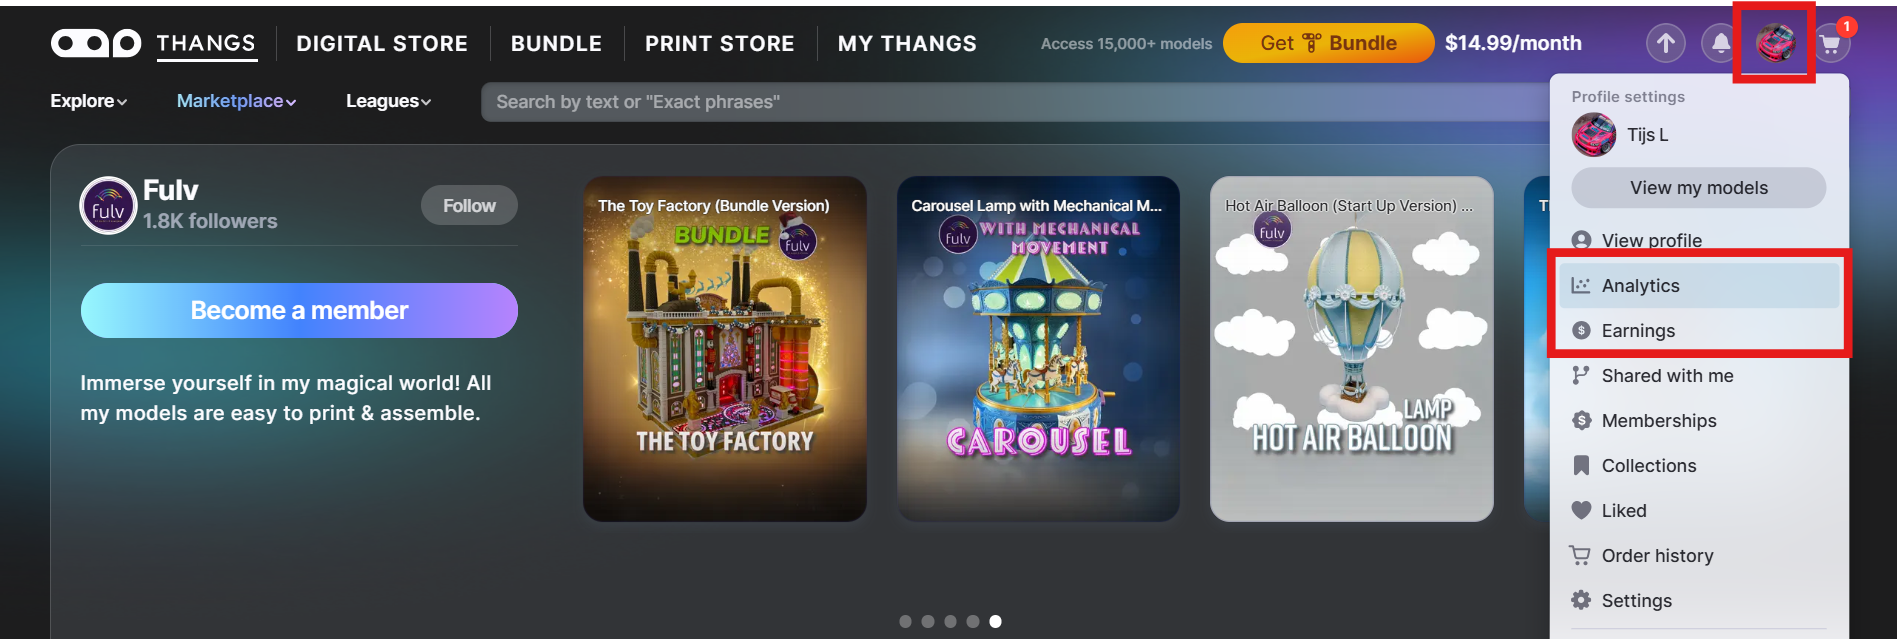
Your Thangs dashboards give you clear insight into what resonates with your audience. This data is crucial for making informed decisions about the future of your designs and the direction of your brand. You’ll find them in your profile under analytics and earnings. In this article we break down each section, so you can find the data that you need.
Designer Analytics
To get all the in’s and out’s of the performance of your store, Thangs has extensive analytics available for all designers. The Designer Analytics pages give you insights on all of your available products, as well all the tools you need to grow and develop your brand.
The analytics are split into three categories.
- Creator Analytics: Give you a clear "big picture" of how your store is doing. You can quickly track your total earnings, see how your traffic is trending through easy-to-read graphs, and check your Affiliate stats. It also gives you a sneak peek at what’s popular across the entire Thangs community, helping you spot the next big trend before you start your next design.
- Commercial Insights: Provide a detailed breakdown of your sales performance across every monetization strategy on Thangs. This page allows you to track specific revenue from new membership sign-ups, individual model and print sales, and your total Bundle earnings in one centralized view.
- Member Insights: A deep dive into your subscriber base and their interaction with your store. This page offers data on individual members—including plan types, contact info, and estimated lifetime value, while tracking broader performance metrics like plan views and user behavior. By identifying exactly where your members are coming from and which specific models are driving conversions, these insights help you understand what truly turns a fan into a loyal supporter.
Understanding your earnings
The “Earnings” dashboard displays details about your earnings as a designer. In addition to tracking total revenue, this section allows you to filter data by specific date ranges and review a complete transaction history of every individual order. For professional record-keeping, you can also download detailed earnings and transaction statements to simplify your personal administration and tax filing.
Stripe Express: Along with your Thangs Analytics, you’ll also find plenty of helpful financial info in your Stripe Express account. You can use it to track every individual payment Thangs sends to your Stripe balance, as well as the monthly payouts to your registered bank account or card. For US-based designers, Stripe also automates your year-end tax documentation by providing 1099 forms directly.
Remember, Thangs pays sales tax in the United States and VAT in Europe and other jurisdictions where it’s required so you don’t have to worry about this when you are reporting your earnings.
You now have the complete toolkit to manage your shop and track your success on Thangs. By mastering your analytics, you can move away from guesswork and start making data-driven decisions to grow your business.


